Below is an image of a SPECT phantom. Using the ROI stats below, calculate the c...
✅ The verified answer to this question is available below. Our community-reviewed solutions help you understand the material better.
Below is an image of a SPECT phantom. Using the ROI stats below, calculate the contrast to noise ratio in the central darker region to 2 decimal places. 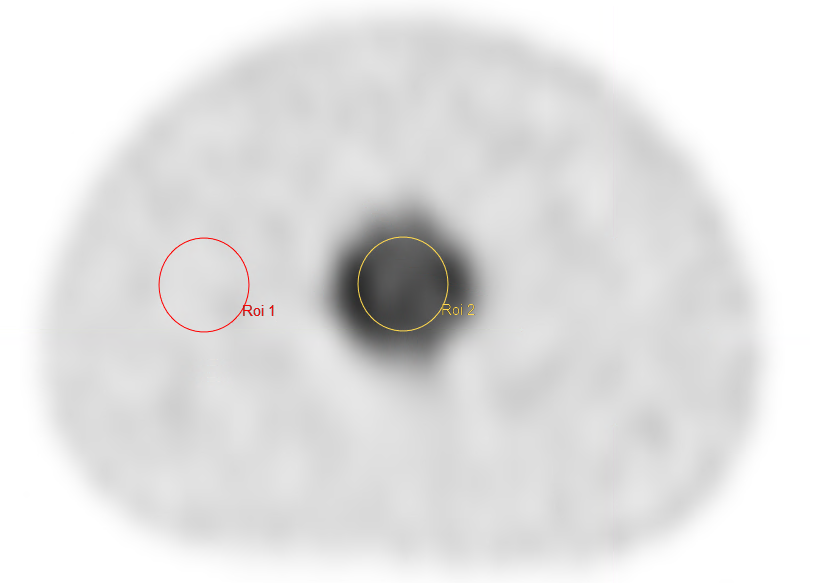 Yellow ROI (central region): Mean = 4.83, Min = 4.15, Max = 5.56, Median = 4.83, standard deviation = 0.32Red ROI (other region): Mean = 0.96, Min = 0.82, Max = 1.30, Median = 0.92, standard deviation = 0.12
Want instant access to all verified answers on moodle.gla.ac.uk?
Get Unlimited Answers To Exam Questions - Install Crowdly Extension Now!